BabelColor
®
Color Measurement
and Analysis
PatchTool PATCH-READER TOOL
file mode


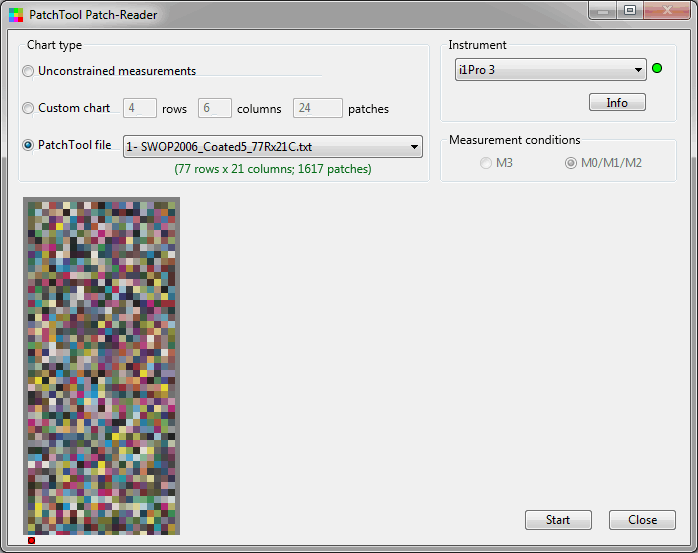
In the Patch-Reader PatchTool file mode you select a file currently opened in PatchTool. The file layout is shown in a preview window; if
required, you can enlarge the tool window to see the complete layout. Click on the "Start" button when ready. The reference patches of the
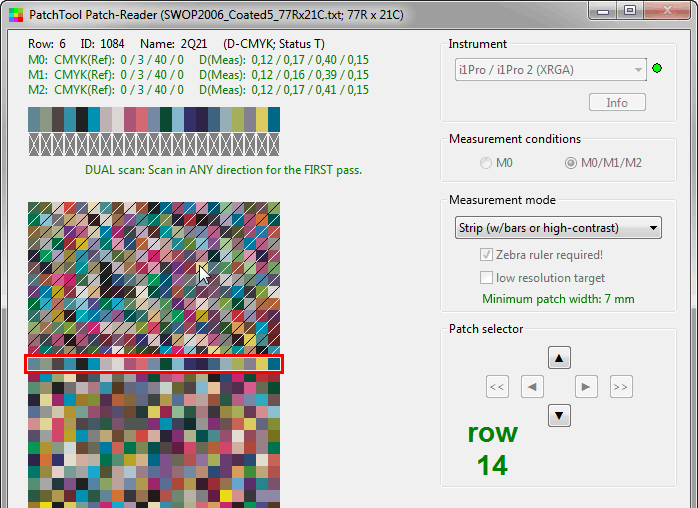
currently selected row are shown in a separate display, on top of the layout, as shown below; here the bottom portion of the top display is
empty since no patches were measured yet on row 14. Patch data corresponding to the mouse position is shown dynamically on top of the
window; here we have CMYK values from the reference file (Row: 6; ID: 1084; Name: 2Q21) and measured density data (Status T, as selected
in the Preferences dialog).

You can select any patch to make individual measurements, or use a timer to automatically make measurements at fixed time intervals. It is
also possible to take measurements one row at a time, by scanning the instrument from one side of the chart to the other (Note: Targets with
contrast bars can easily be created with PatchTool). For the measurements of the screenshot above we selected the M0/M1/M2 measurement
conditions, which require two measurement passes per line for an I1Pro 2.
The Zebra (i.e. encoded) ruler is selected (and disabled) and the low
resolution target option is not available. Please consult the Help manual for
more information on the various measurement modes available. Because we
use the Zebra ruler, we can start the first scan in any direction, as indicated in
the screenshot; the second scan shall be done in the reverse direction.
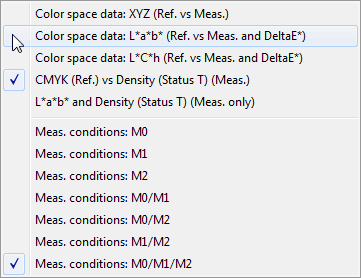
The displayed data types can be selected with a menu, shown here
(Measurement mode: Strip), which opens with a right-click over the chart.
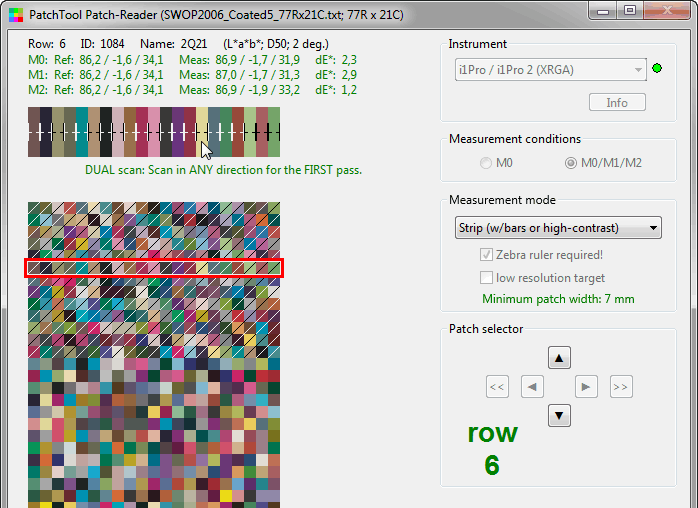
In the screenshot at the bottom of the page, the patch data shows the
reference and measured L*a*b* values as well as the CIELAB color difference.
We have also selected row 6, an already measured row.
You can click the “Stop” button at any time. If you decide to keep the measurements, you are presented with the CGATS file options dialog,
shown on the next page, that presents options to be used for saving the CGATS compatible file; this file can be readily opened by PatchTool and
most programs which can read color files. Screenshots of the "Unconstrained" and "Custom chart" measurements modes are shown on the
previous pages.


BabelColor
®
PatchTool PATCH-READER TOOL
file mode

In the Patch-Reader PatchTool file mode you select a
file currently opened in PatchTool. The file layout is
shown in a preview window; if required, you can enlarge
the tool window to see the complete layout. Click on the
"Start" button when ready. The reference patches of the
currently selected row are shown in a separate display,
on top of the layout, as shown below; here the bottom
portion of the top display is empty since no patches
were measured yet on row 14. Patch data
corresponding to the mouse position is shown
dynamically on top of the window; here we have CMYK
values from the reference file (Row: 6; ID: 1084; Name:
2Q21) and measured density data (Status T, as selected
in the Preferences dialog).
You can select any patch to make individual
measurements, or use a timer to automatically make
measurements at fixed time intervals. It is also possible
to take measurements one row at a time, by scanning
the instrument from one side of the chart to the other
(Note: Targets with contrast bars can easily be created
with PatchTool). For the measurements of the
screenshot above we selected the M0/M1/M2
measurement conditions, which require two
measurement passes per line for an I1Pro 2. The Zebra
(i.e. encoded) ruler is selected (and disabled) and the low
resolution target option is not available. Please consult
the Help manual for more information on the various
measurement modes available. Because we use the
Zebra ruler, we can start the first scan in any direction,
as indicated in the screenshot; the second scan shall be
done in the reverse direction.
The displayed data types can be selected with a menu,
shown here (Measurement mode: Strip), which opens
with a right-click over the chart.
In the screenshot at the bottom of the page, the patch
data shows the reference and measured L*a*b* values
as well as the CIELAB color difference. We have also
selected row 6, an already measured row.
You can click the “Stop” button at any time. If you decide
to keep the measurements, you are presented with the
CGATS file options dialog, shown on the next page, that
presents options to be used for saving the CGATS
compatible file; this file can be readily opened by
PatchTool and most programs which can read color files.
Screenshots of the "Unconstrained" and "Custom chart"
measurements modes are shown on the previous pages.